Code and Report at Github
This project is a statistical analysis of the sizes of files sent through an internet network. The distribution of the data given by x, is modelled by a Pareto statistical model and the maximum likelihood estimator along with its distribution is estimated. Thousand files of varying sizes(in kB) are selected. The probability density function for the Pareto model is given by-
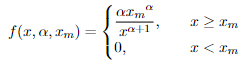
and 1000 is the minimum possible value of xm (xm ≥ 1000).
Towards the end, the likely sizes of 1000 files that would flow through the network in the following month and following the Pareto distribution with the derived ˆα- the estimator and xm have been simulated to estimate their distribution.
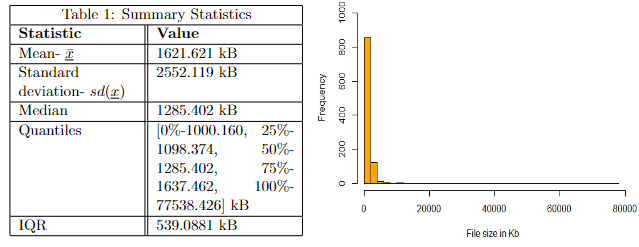
Code was written in R to tabulate summary statistics shown in the table such as the
minimum value, 1st quartile, median, 3rd quartile and maximum value. The mean or
average of the data was calculated along with the standard deviation. Inter Quartile Range
(IQR) has been computed as well.
The mean the data can be observed to be higher than the median indicating that most
values are towards the lower end with the longer tail being towards the right. Thus, it is
said to be positively skewed and this is inferred from the histogram as well. The standard
deviation is quite high which indicates that many data points are far from the mean.
Apart from illustrating the skewness of the data, the histogram proves and
reinforces the fact that data with Pareto distribution is skewed and has a heavy/long tail. Most data is seen on the far left indicating that most values are on the lower end. The
one data point- 77538.426 is not displayed on this histogram with 50 bins as the frequency
of samples around that value is just 1.
Value given by n% quartile indicate that n% of data have values less than the given value.
The quantiles are in the order as follows- minimum value, lower or first quartile, median
value, upper or third quartile, and maximum value. Only a quarter of the sizes are less than
1098.374 Kb and another quarter of the data exceeds 1637.462 Kb. IQR measures the
spread of the mid-ranged data and the range for the middle 50% of data is 539.081 Kb.