This project focuses on analyzing sales data to uncover insights into customer behavior, product sales, and revenue trends. By leveraging SQL for data analysis and visualizing the results in a Tableau dashboard, we aim to provide a clear and actionable overview of key business metrics. The data is from https://data.world/dataman-udit/us-regional-sales-data.
Interactive Tableau Dashboard
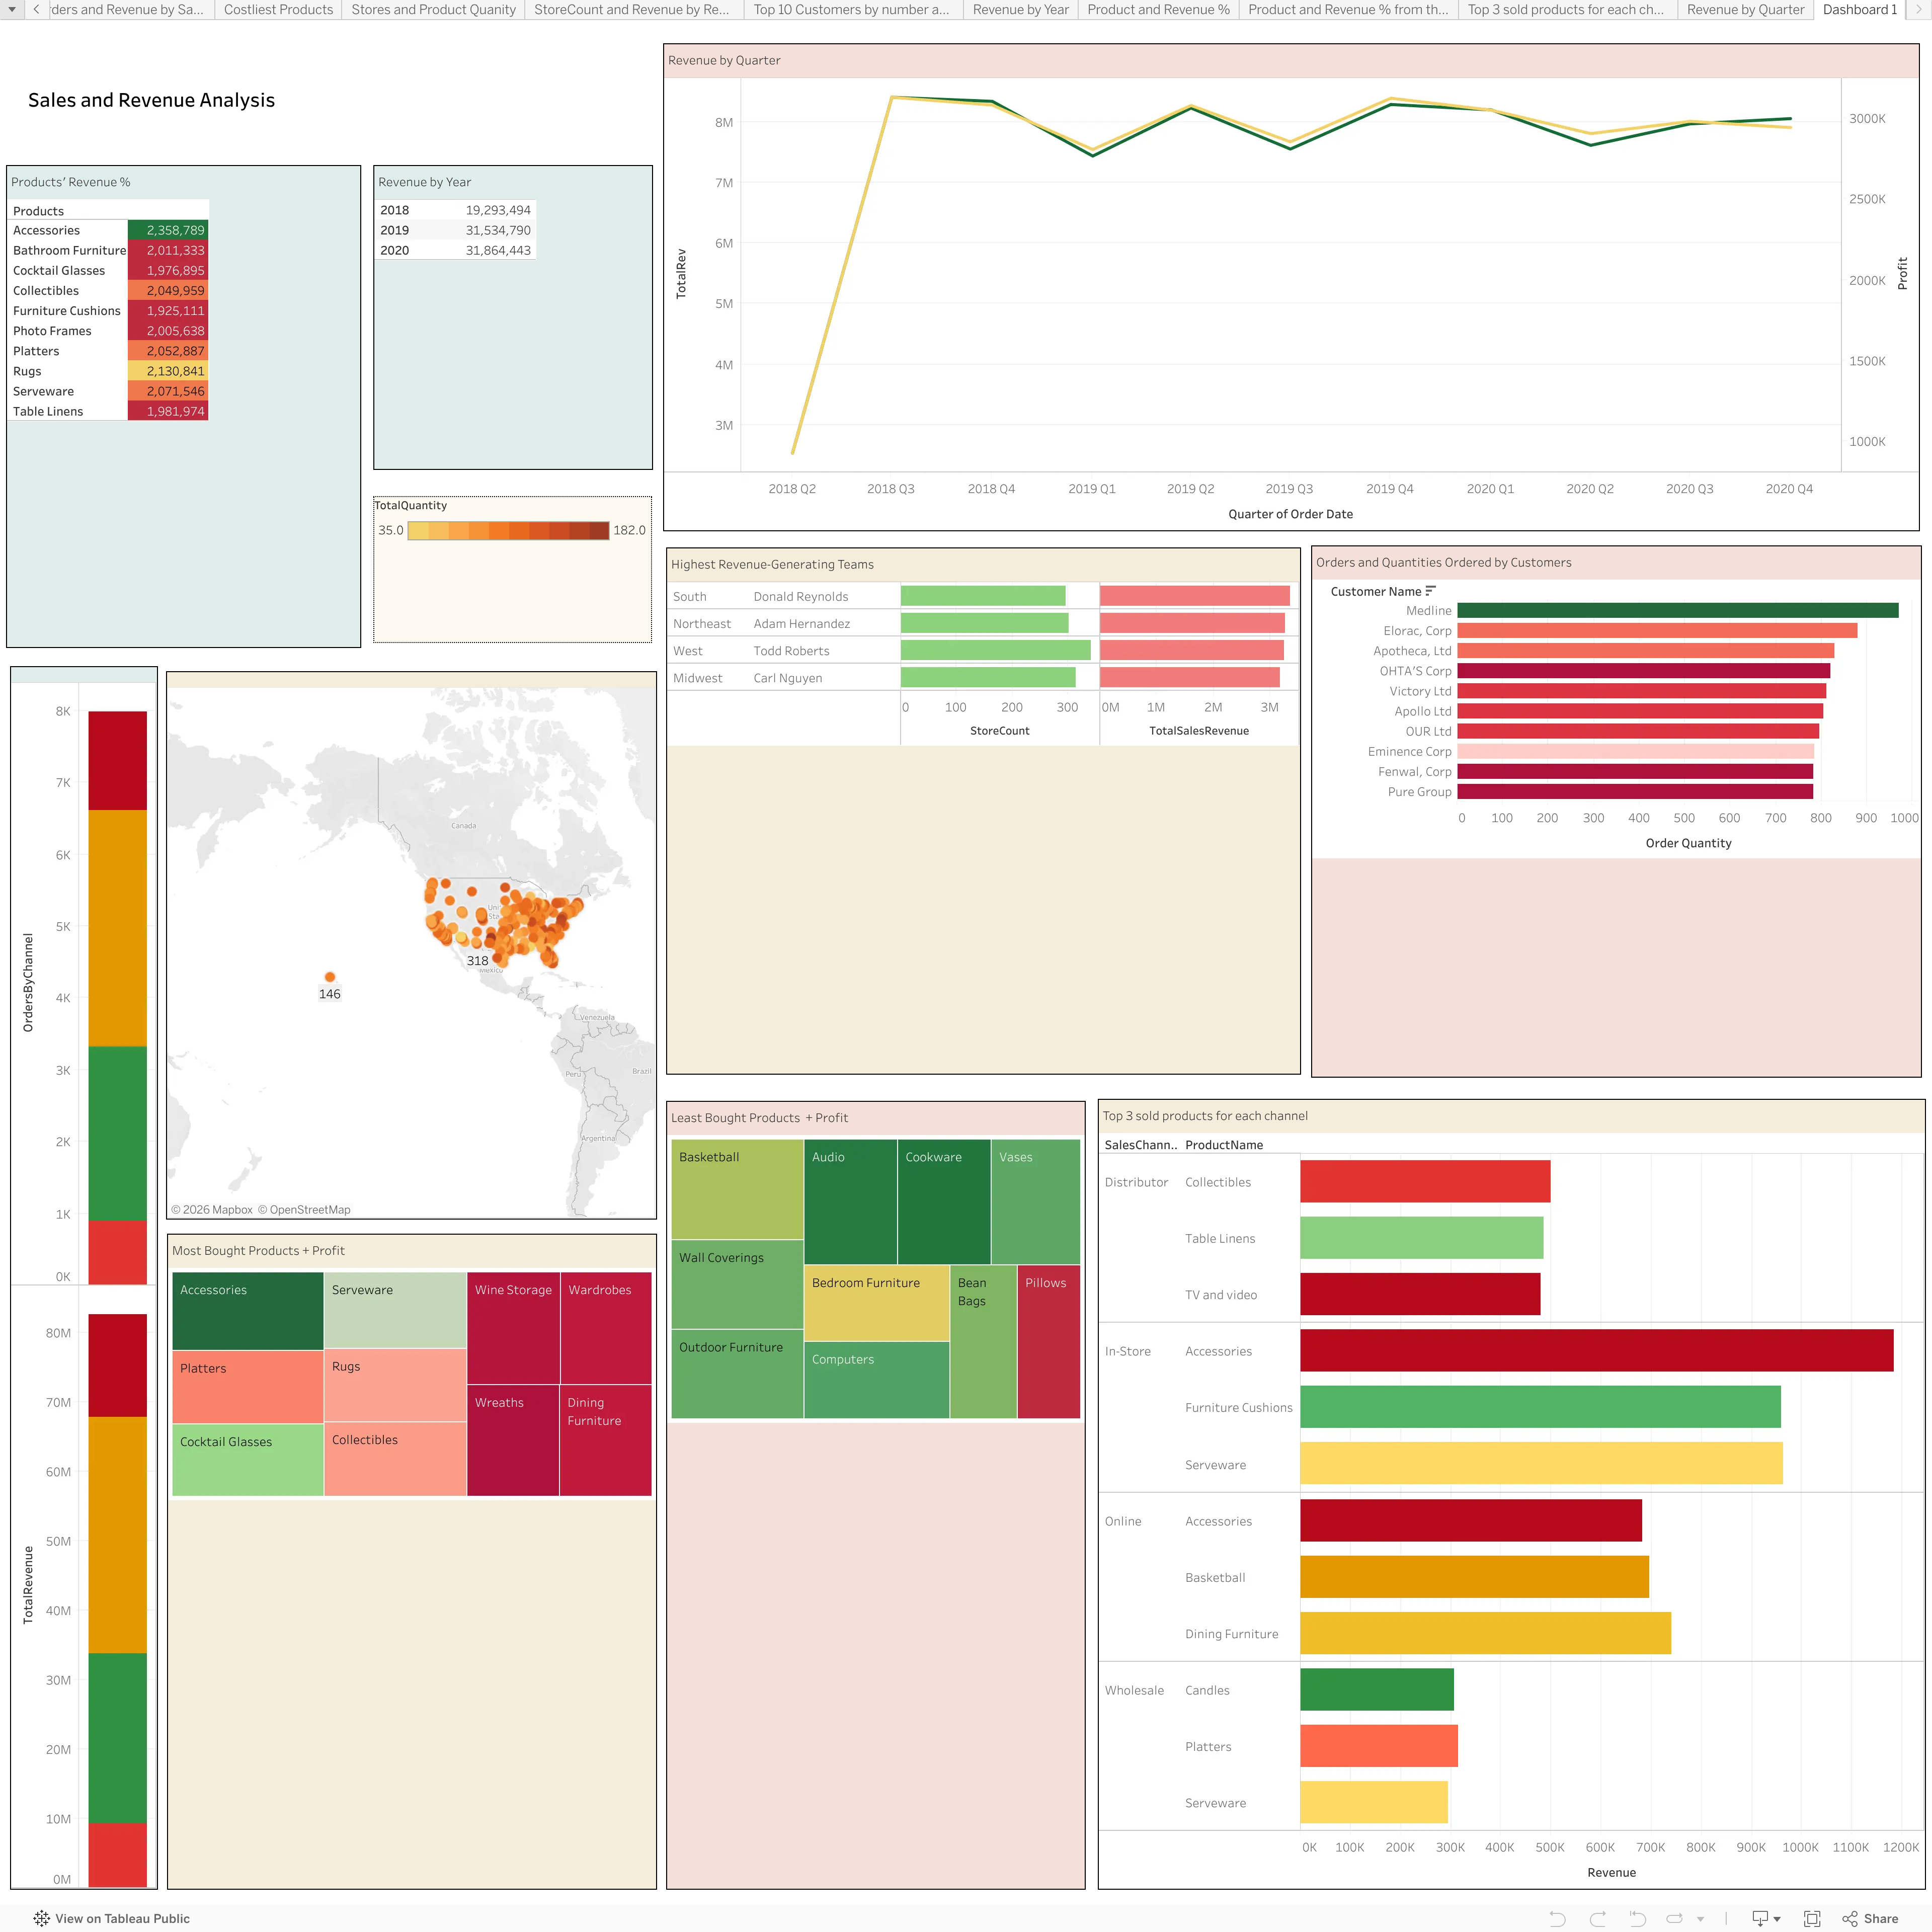
The Tableau dashboard visualizes these insights, enabling stakeholders to understand and act on the findings, optimizing strategies for better revenue and customer experience.
Some Insights
Orders by Day of the Week: Orders are relatively evenly distributed across the week, with Saturday showing the highest number of orders (1194) and Wednesday the lowest (1099). Weekends (Saturday and Sunday) show higher order activity, indicating higher consumer engagement during weekends.
Percentage Contribution of Products to Total Revenue: The analysis ranks products based on revenue contribution. For instance, Accessories and Rugs are among the top contributors, each making up around 2.85% and 2.57% of total revenue, respectively. A few products contribute significantly to the revenue, indicating possible flagship products or high-demand categories.
Revenue by Month: Revenue trends show peaks and troughs, with consistent increases during holiday seasons like December. Seasonal trends highlight increased sales during holidays, suggesting that planning promotions around these periods could boost revenue.
Top 3 Products Sold by Sales Channel:
| Sales Channel | Top 3 Products |
|---|---|
| Distributor |
1. Collectibles - $500,322.50 2. Table Linens - $484,838.80 3. TV and Video - $479,800.40 |
| In-Store |
1. Accessories - $1,184,854.80 2. Serveware - $962,977.60 3. Furniture Cushions - $960,116.70 |
| Online |
1. Dining Furniture - $739,807.30 2. Basketball - $696,679.40 3. Accessories - $682,642.90 |
| Wholesale |
1. Platters - $314,156.30 2. Candles - $307,255.30 3. Serveware - $294,974.20 |
Shipping Speed: Orders are categorized into Fast, Standard, and Slow shipping, with most orders in Standard Shipping (3249 orders). The significant proportion of Slow Shipping could impact customer satisfaction, suggesting a need to optimize logistics.
Recommendations
- Optimize Marketing and Sales Strategies for Weekends: Targeted marketing campaigns or promotions on Fridays and Saturdays can capitalize on higher weekend order volumes.
- Focus on High-Performing Products: Expanding high-revenue products like Accessories and Rugs, optimizing stock, and considering cross-selling can enhance revenue.
- Seasonal Promotions: Plan ahead for holidays with early bird discounts or bundled offers to boost sales during peak months.
- Channel-Specific Strategies: Tailor strategies to each sales channel, such as focusing on in-store promotions for Accessories and Serveware, and enhancing online visibility for Dining Furniture and Basketball items.
- Improve Shipping Efficiency: Optimize logistics to reduce Slow Shipping orders, potentially by improving inventory management and partnering with faster delivery services.
- Price Optimization: Use moving average analysis to adjust pricing dynamically, staying competitive while maximizing margins.