Code at Github
This project involves implementing two biologically inspired optimization algorithms- the
Genetic Algorithm (GA) and Particle Swarm Optimization (PSO) in Python and comparing the
performance of these algorithms on three benchmark functions. The candidate solutions are chosen
in such a way that the output of the function for the solution is minimized. The optimum
hyperparameters for each of the algorithms for each of the functions were found. Comparisons were
made between the performances of the algorithms on the three functions.
Benchmark Functions
Benchmark functions or test functions are used for evaluating and comparing optimization
algorithms. Also known as artificial landscapes, they are classified into unimodal and multi-modal
functions where the sole aim is to minimize the output of the function or find a global optimum within
the permissible values within the function’s bounds [1]. Unimodal functions are monotonically
increasing or decreasing (e.g. Sphere function (F1)) while multi-modal functions can have multiple
local optima but would have only one global optimum (e.g. Griewank’s (F4) and Rastrigin’s (F6)).
Inputs are multi-dimensional where a list/vector of multiple real numbers would be optimized so that
the functions output the least possible value. Sphere, Griewank’s, and Rastrigin’s functions (taken
from [6]) were optimized and the global optima for all three are 0 in all dimensions and the minimum
value of the function is 0 too. These functions were selected to cover both function types and test
our implementation in different fitness landscapes.
Genetic Algorithm
The Genetic Algorithm is a class of evolutionary algorithm that is broadly inspired by biological
evolution. The algorithm uses an encoding of chromosomes (vector of real numbers), fitness
(benchmarking functions), parent selection method (tournament selection), genetic recombination
(one-point crossover of parents) and mutation (mutating the chromosomes).
We start by initializing a randomly generated population, where each individual in the population has
a position that is filled with a random number of genes or dimensions. In the case of this project, this
will be set at 10. Selection is the first step to creating a new population for the next generation, and
consequently for each successive population, a new generation is selected to breed.
We use tournament selection to define the best fit individuals, where several tournaments are run and the
individuals with the best fitness are selected for crossover. We set the tournament size (or as in our
code, ‘k’) to be more to 10, to make it more selective in our algorithm. A one-point crossover is then
used to cut the parent chromosomes at the same random point and then swapping the leftover
individuals to produce new offspring. The crossover rate here determines whether crossover has
been performed or not.
Though the correlation is not significant, it is positively associated with the
mutation rate. Mutation is performed on the chromosomes subsequently, with a mutation rate that
Sphere Function [4] Griewank’s Function [2] Rastrgin’s Function [3]
decides the percentage the gene would be modified or mutated. Once the offspring undergoes
mutation, they are evaluated based on the cost or fitness function and the best solution is printed or
reported.
Particle Swarm Optimization
PSO is a population-based optimization algorithm where the search for the optimum point is based
on the flocking behaviour of birds as swarms. The individual solutions or particles are initialized in
the search space bounded by the bounds and are given by position- its coordinates and velocitywhich gives how much to move, for each of the dimensions in the search space. Fitness is defined
as the measure of how close the position is close to the optima or the function’s output to the
minimum value. In each iteration, the particle with the best fitness is found while updating the
particle’s best position and the best position found so far. Considering these, the particle’s position
and velocity are updated.
Informants are neighboring particles in the same space as a particle with which it can share
information. They are selected randomly for each particle in every iteration as mentioned in [5]
depending on the decided number and the best position found by one among them is stored. The
velocity of a particle is affected by its current and best position found, the best position found by any
of its informants or any particle in the search space. These components are weighted by inertia
weight, cognitive weight, social weight, and global weight, in the same order. These values were
selected after extensive experimentation while giving less weight to social weight among the rest.
This velocity is weighted by the step size parameter (epsilon) and is added to the position of the
particle to influence its direction and aid in guiding it toward the optimal point. The step size
parameter reduces how far particles move and this has been experimented with to improve the
algorithm’s performance. Its value starts from 0.9 and is decremented with each iteration until 0.4 in
accordance with the guidance provided in the lecture slides. A plot has been created to plot the
values of the functions’ output over iterations and only the y coordinates (best outputs) are plotted
on a log scale for easier scaling.
Testing GA and PSO
Each of the functions was attempted to be optimized by running PSO and GA and calculating an
average best output value which when closer to 0, corresponds to better fitness or it being closer to
the global optima.
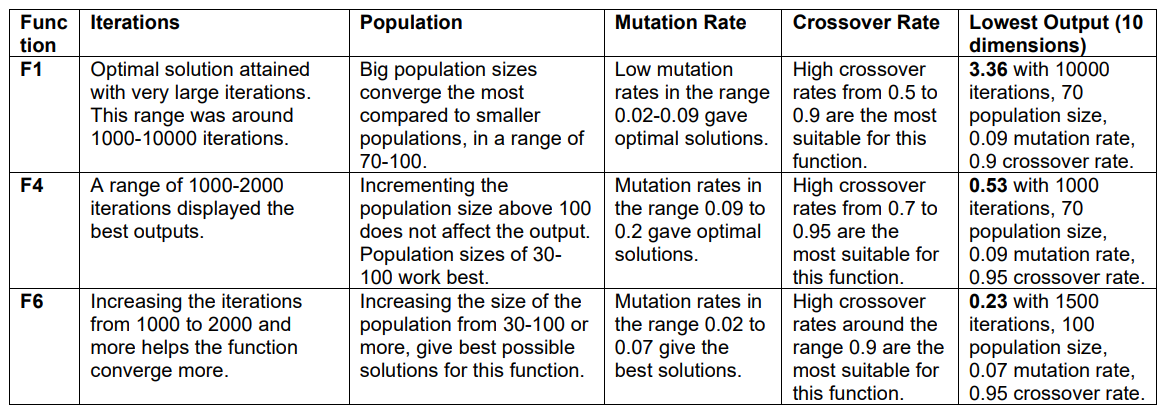
Genetic Algorithm : The hyperparameters for GA were tested across many ranges and values, and the following
inferences were observed. Selecting the initial population is an important factor to consider when
evaluating GA. A small population may lead to poor solution, and so most of our experimentations
are centered around appropriate population sizes of 50-200 depending on the function.
Additionally, increasing the number of iterations helped converge to the optimal solution, though the
number of iterations were dependent upon the problem. The mutation and crossover rates also
have significant impact on the optimization of the solution. While the crossover rates are generally
high, usually 0.5-0.9, mutation rates needed to be tested and tried for each function. A too high
mutation rate increases search space but prevents it from converging to any optimum solution, and too
small mutation rate may result in premature convergence.
It is also observed that GAs performs better
on unimodal functions compared to multimodal functions. Throughout experimentation of this
algorithm, it was noted that GA takes a long time to converge and optimize to give the best possible
solutions. The best solutions averaged over 3 runs give values 0.9 for f4, 0.2 for f6 and 3.19 for f1. Lists of best population sizes, mutation and crossover rates, and iterations were
made to display optimal values for each function. An average of 3 (due to complexity heaviness)
runs were recorded to account for the distribution of results on a series.
PSO : The hyperparameters for PSO were tried and tested with various values in acceptable ranges.
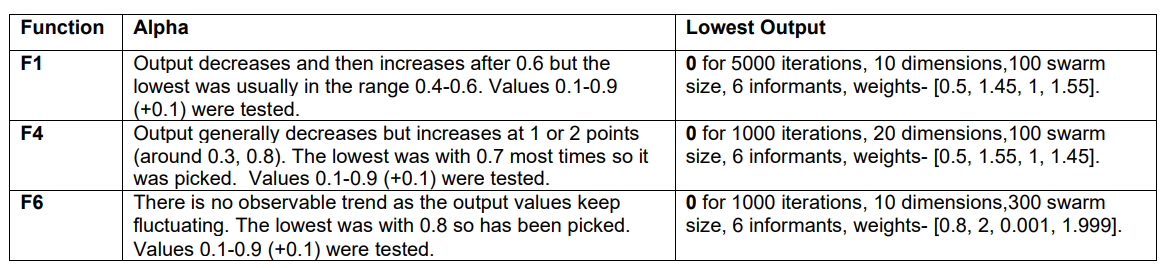
Swarm size, number of dimensions and iterations, and alpha are experimented with mainly. The
informants’ positions are given lower weights while the other two beta and delta were usually almost
equal. These three values add up to 4 in accordance with the guidance in the lecture slides.
Similarly, the number of informants has been selected as 6 after trials and following [7]. Swarm size,
number of dimensions and iterations, and alpha are experimented with. Higher swarm sizes and
iterations are time-taking but yield lower output and better solutions. Swarm sizes tested were
arbitrary in range- 30-300, and iterations in range- 50-5000 (every 100/1000th value). Lower
dimensions yield minimized results; the tested range was 1-30, leaving out a few values in between.
The average best outputs of 10 runs were displayed where the number of dimensions was selected
to be 10 to adhere to the coursework specifications (except for f4 where 20 was chosen) and 1000
iterations were chosen for f4 and f6 but 100 for f1. The following table consists
of information about the influence of the alpha on the output. Occasional inconsistencies were
observed thus, general trends are better estimates than the exact values in all cases.
The optimal solutions for PSO were comparatively better that those of GA for the same population
and iterations. PSO also converged faster and ran computationally heavy combinations of large
populations and many iterations. GA is a discrete optimization problem, while PSO is a continuous
technique. The functions f1, f4 and f6 being all continuous, hence show the best possible optimal
solutions with the PSO implementation as compared to the GA implementation. Thus, for this setup, we
can conclude that PSO is more efficient than GA in optimizing the benchmarking functions.
References
[1] ‘Test functions for optimization’, Wikipedia. Jul. 24, 2022. Accessed: Nov. 26, 2022. [Online]. Available:
https://en.wikipedia.org/w/index.php?title=Test_functions_for_optimization&oldid=1100056552
[2] ‘Griewank Function’. https://www.sfu.ca/~ssurjano/griewank.html (accessed Nov. 26, 2022).
[3] ‘Rastrigin Function’. https://www.sfu.ca/~ssurjano/rastr.html (accessed Nov. 26, 2022).
[4] ‘Sphere Function’. https://www.sfu.ca/~ssurjano/spheref.html (accessed Nov. 26, 2022).
[5] S. Luke, Essentials of metaheuristics: a set of undergraduate lecture notes; Online Version 2.0, 2. ed. S.l.:
Lulu, 2013.
[6] J. Liang, K. Qin, P. Suganthan, and B. Subramanian, ‘Comprehensive Learning Particle Swarm Optimiser
for Global Optimisation of Multimodal Functions’, Evolutionary Computation, IEEE Transactions on, vol. 10,
pp. 281–295, Jul. 2006, doi: 10.1109/TEVC.2005.857610.
[7] J. Garcia-Nieto and E. Alba, ‘Why six informants is optimal in PSO’, in Proceedings of the fourteenth
international conference on Genetic and evolutionary computation conference - GECCO ’12, Philadelphia,
Pennsylvania, USA, 2012, p. 25. doi: 10.1145/2330163.2330168.