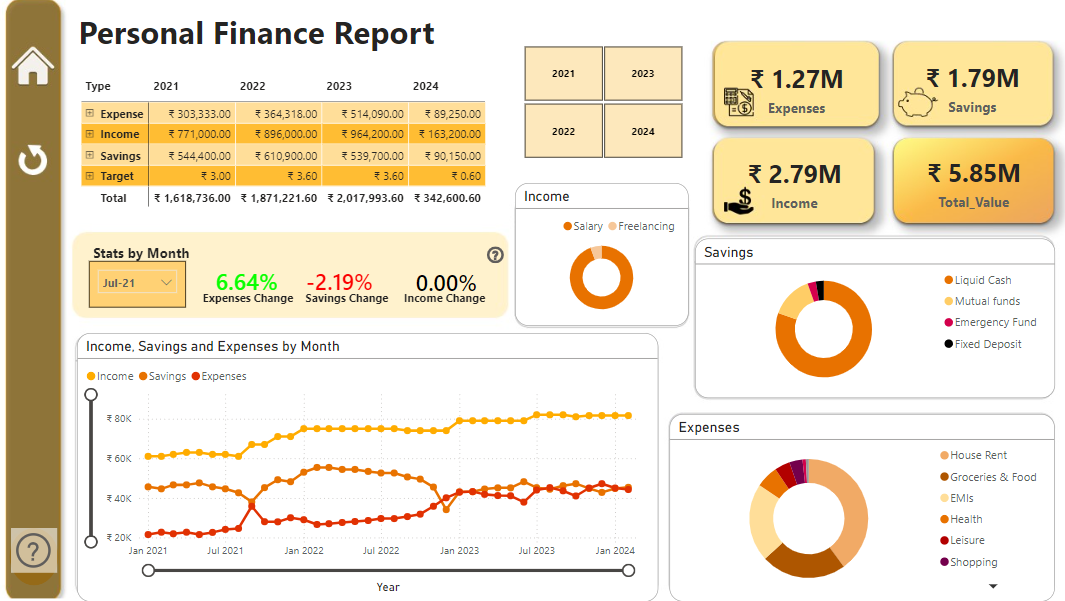
This interactive Power BI dashboard provides a comprehensive view of a person’s finances over more than three years, covering 2021 to the initial months of 2024. It visualizes key financial metrics including income, savings, and expenses, with a breakdown available for each year. The total amounts for these metrics is displayed as cards. The dashboard allows filtering by year and breaks down savings into categories like cash, mutual funds, and fixed deposits, and income sources such as salary then followed by freelancing. Expenses are categorized into rent, groceries, and EMIs, mainly which are all shown as donut charts. A line chart displays income, savings, and expenses trends by month. Additionally, specific cards show changes in expenses, savings, and income, which can be filtered by selecting a particular month in a given year. This dashboard offers a clear, detailed, and user-friendly way to track and analyze personal finances.