Retailer Sales and Profit Analysis Dashboard
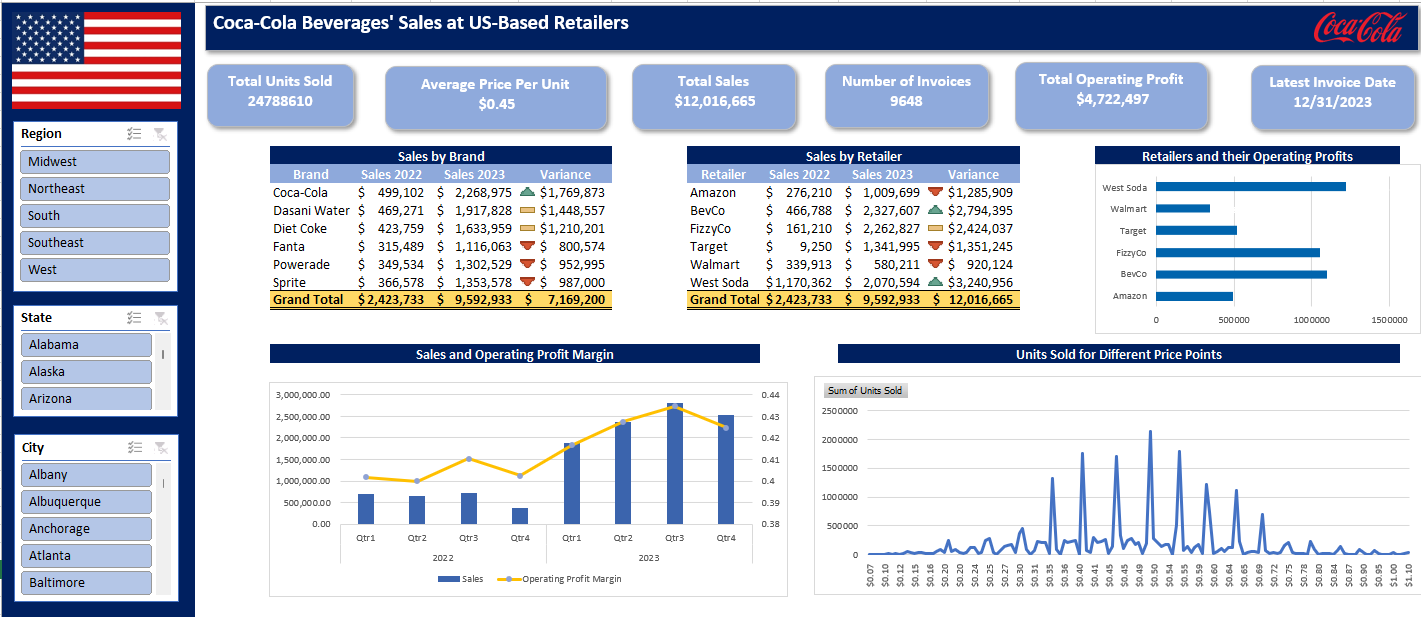
This project features an interactive dashboard designed to analyze and visualize key sales and profit metrics for a major retailer- CocaCola's products in the US in order to encourage data-driven decision-making at various levels.
The dataset includes detailed information such as retailer names, invoice dates, geographical regions, states, cities, beverage brands, price per unit, units sold, total sales, operating profit, and operating margin.
The dashboard enables users to gain valuable insights into the performance of various beverage brands under CocaCola and retailers across different locations. It was created using visualizations made from Pivot tables created.
Dashboard Features:
1. Dynamic Filtering by Location:
The dashboard includes filtering options that allow users to view data by specific regions, states, and cities. This functionality makes it easy to drill down into local market performance and understand how different geographical areas are contributing to overall sales and profitability.
By selecting specific filters, stakeholders can understand the data for targeted locations, providing a deeper understanding of regional trends and helping to inform strategic decisions.
2. Comprehensive Sales and Profit Analysis:
The dashboard presents a comprehensive view of sales and operating profits by beverage brand and retailer.
It includes various visualizations, such as bar charts and line graphs, along with tabular representations to depict year-over-year sales growth, operating profit margins, and the variance in sales between different time periods.
3. Forecasting Future Sales Trends:
The dashboard also features a dedicated forecast tab, which utilizes historical sales data to predict future sales trends.
By applying time series analysis techniques, the forecast tab provides estimates of future total sales, including lower and upper confidence intervals.
This feature could aid businesses anticipate market conditions and plan accordingly.
Recommendations
Sales trends could be studied to manage inventory effectively,
avoiding stockouts and excess stock. Pricing could be adjusted to boost sales and profits, and focus on promoting high-margin products.
Regional sales data would deem useful for targeted marketing, exploring new markets, and strengthening partnerships with retailers for financial growth.