Customer churn is the loss of customers. As a group, we had been tasked with analyzing the customer
churn rate for the eCommerce clothing website we had created. Our goal is to identify the factors that contribute to
customer churn and suggest measures to prevent it. To achieve this, we have analyzed the historical
data generated using Mockaroo [10] in a typical e-commerce scenario, which includes customer
behavior, demographics, purchase history, and feedback. The code and the detailed project here is only about calculating and predicting customer churn.
Churn Prediction using Machine Learning
The churning of customers is the phenomenon in which customers leave the business. Customers are
individuals who have already undertaken the process of buying products or engaging in business
contracts. To predict customers’ next move, machine learning was utilized because it is important to
take action to avoid further withdrawal of customers. The huge amounts of data collected in a real
situation cannot be handled by humans efficiently thus, it made sense to employ these techniques to
make the data suitable for providing necessary value to our business. Machine learning is the process by
which machines learn from data rather than humans having to explicitly write lines of code [8]. The data
used and the algorithms employed are described further to discuss the results of our analysis and the
changes we would make to our business to improve customer satisfaction and reduce customer
churning.
Dataset
It would be helpful to know customers’ opinions on the store to predict if they would leave our store. As
a reason, it was set up so that each customer had an opportunity to provide feedback on their
experience of using the store and answer useful questions that would enable us to improve the store
and their experience so that we minimize customer churning or customer deleting their accounts in our
website. A google form was made as a touchpoint to collect data from the customers after each of their
purchases.
It has questions related to the customer’s rating 1-5 for the quality of the products, delivery
experience, how appropriate they think the prices of the products in the store are, the website’s design
and look, customer service provided by our company, and lastly, how likely they are to recommend our
company to others. These ratings will help the company understand the customers’ opinions on the
offerings of a business (their products, website, and services) and these in turn could explain the drop or
increase in the number of customers.
All the attributes correspond to the questions in the form and have been given self-explanatory names.
For example, last_purchase_before is the number of days since the last purchase, time_spent_last is the
duration of the customer’s last session on the website, and account_creation_before means the number
of days from the time of creating the account. The churn value could be 0 or 1 where 0 means the
customer stays with the company and 1 is for when they leave it.
Since we could not collect enough data for using the model, we have generated 1000 records that will
be used for this purpose. The data has been generated using Mockaroo (See samples in Figure. 3). All
the records are generated randomly while the churn value was generated using a customized random
distribution as it is supposed to be at least slightly dependent on or influenced by the other factors in
the dataset.
The attributes- likeliness_to_recommend, product_quality, delivery_experience,
price_aptness, website_design, and customer_service have been used for this and it has been set up
such that churn is inclined towards (more probability is given during generation based on the conditions
setup) 1 for 1 and 2 ratings and ten towards 0 for 4 and 5 ratings. For example, for likeliness to
recommend, if the rating is 5, the churn value is 3 times more likely to be 0. For a rating of 3 associated
with an attribute, both 0 and 1 are equally likely. The churn rate for this data is given by-> (number of
customers at the beginning - number of customers at the end) / number of customers at the beginning -
> number of churned customers/number of customers at the beginning -> (1000-522)/1000 = 0.478 or
47.8%.
Python programming language has been selected to implement the model so the code has been written
in a Jupyter notebook for better readability. The data has been cleaned to not have any duplicate
records, missing values in any of the attributes, or any null values to ensure that it is suitable to be used
in Python. Although the data was properly generated with all valid values, this step was still taken to
ensure the data is ready to be used. It has also been explored to see the distribution of values for each
column and visualize their impact on the value of churn.
Algorithms
For the task of analyzing the most influential factors behind customers leaving the store and predicting
the next move of the customer to either continue shopping or to completely engage with the online
store, a machine learning model has been implemented. The model experimented with in this project is
called a Decision Tree. Other popular alternatives to decision trees include Random Forests which are a
collection of decision trees [4]. These seem to be better alternatives according to [3][5] however, they
have not been explored due to it being out of the scope of this project. We have also experimented with
Regression apart from classification. These topics will be explained further below.
A decision tree is a supervised (trained with labels) machine-learning model which learns from the
decision rules of the data and its labels. Its structure resembles that of a flowchart, and it consists of
nodes where ones without any further branches (or children) are called leaves. The target variable is
understood by analyzing the attributes associated with it. This has been selected because it is a popular
choice for this purpose, it is easy to comprehend and can be visualized using Python which enhances the
experience further. However, they can have overfitting of data which means it underperforms unseen
data.
The decision tree classification model (to classify instances as churn or no churn) has been instantiated
from [7]. The values it was initialized with are criterion- ‘gini’, ‘min_samples_leaf’ is 3, ‘max_depth’ is 5,
and splitter is 'random'. Criterion is the splitting criterion (a measure of node impurity) which has been
selected to be entropy, minimum samples leaf is the number of leaves to be there as the leaves,
maximum depth is the depth of the tree or the number of levels down the tree, and splitter is the
condition at which the node should be split (best random split is chosen) [7]. Gini is the measure of
impurity or of how many instances were misclassified at a split and values close to 0.5 mean the
assignment was completely random (0 is pure) [2]. These have been selected after performing Grid
Search over the values.
Grid Search is an exhaustive search over all possible values of the
hyperparameters to select the best ones for a given dataset and model and it has been implemented
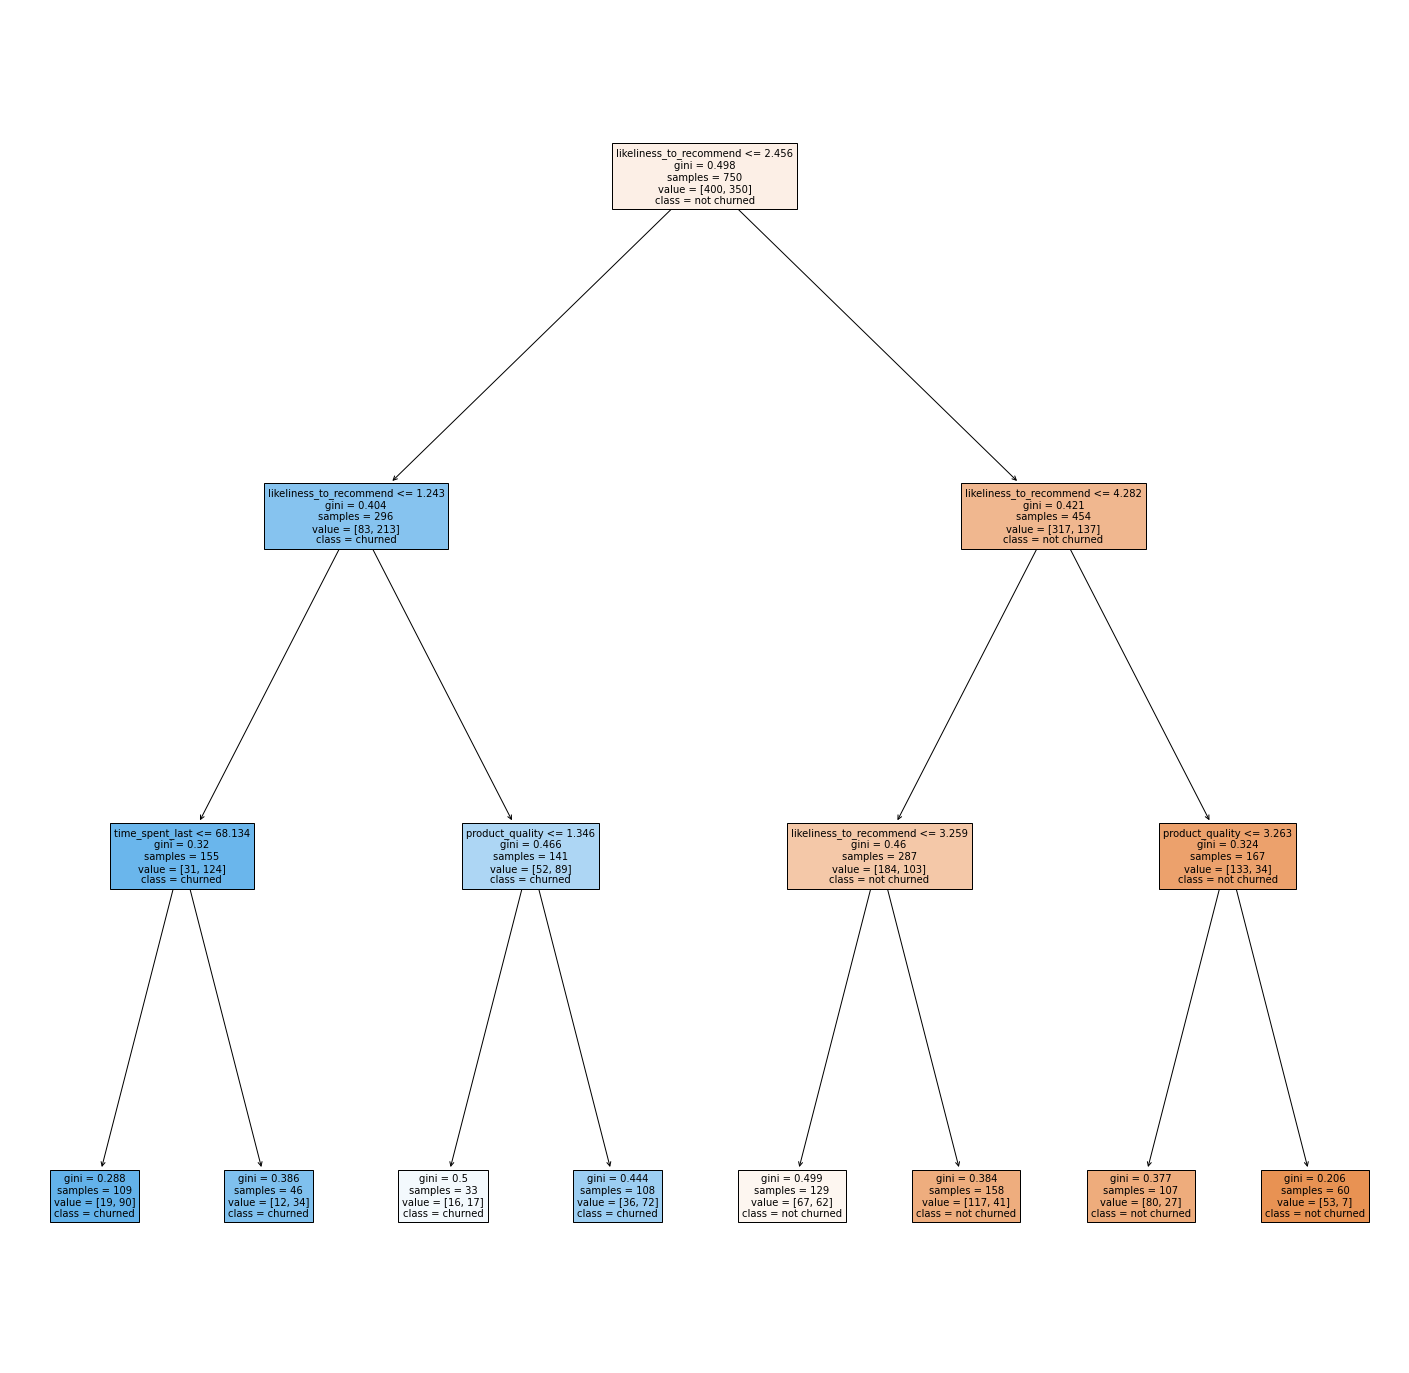
using [6]. The decision tree generated is given below.
It can be inferred that the most influential factor given on the root node (first node) is the customers’ likeliness to recommend.
The data has been split into training and testing datasets in a 3:1 ratio randomly.
‘likeliness_to_recommend’, ‘time_spent_last’, ‘product_quality’, ‘delivery_experience’, ‘price_aptness’,
‘website_design’, and ‘customer_service’ are used for constructing the decision tree. Training the model
involves learning patterns from the data [9].
The data is almost balanced (contains an almost equal number of instances that have a churn value of 0
and 1) as 53-47 is considered balanced. Due to this reason, accuracy around 50% could mean the model
is giving only 0/1 thus matching almost half the records that have that value already. So, it is now a
better training set enabling the model to learn both values equally thus improving the model’s ability to
produce both 0s and 1s depending on the other values. The final values (unweighted averages) obtained
after training and after testing are given in Table 1. Since the values are satisfactory and did not improve
after trying different initial decision tree parameters, the search was stopped here.
| Process | Accuracy | Precision | Recall | F1 Score |
| Training | 70.6% | 71% | 70% | 70% |
| Testing | 72% | 73% | 72% | 72% |
Analysis and Solution
For coming up with a plan to improve customers’ experience with the store, all the attributes suggested
by the implemented decision tree and regression model were considered. Since the results obtained
from both are similar, they hold greater weight and validate the decisions and changes considered.
The likeliness to recommend is the most influential and it does imply that customers who would
recommend the website to others would also prefer to continue buying from the same. An idea is that
customers can be sent referral coupons after their purchase which can be shared with their acquaintances.
These would give small discounts to the sender and the receiver. Sharing the website or
products can also be rewarded with occasional coupons and this would be announced to all. The quality
of the products seems to impact the churning too as it is necessary for any business to function for long
so it would be taken care of to not be compromised. Additionally, the sustainable nature and sources of
material can be advertised for better reach. Time spent last on the website can be improved by adding
more products, categories, filters to find products, an AI-based product finder so that they keep coming
back to search for any new design, and daily rewards to collect to improve their interaction with the
website.
All changes need to be communicated to the customers so that they are aware of these changes and
take an interest in exploring them. Customers unsatisfied with these aspects are more likely to leave and
vice versa. Good reviews from other customers regarding all these factors are also crucial for others to
continue buying products. Regular feedback forms with related questions can be helpful to get their
opinions time-to-time.
References
[1] T. Kanstrén, “A Look at Precision, Recall, and F1-Score,” Medium, May 19, 2021.
https://towardsdatascience.com/a-look-at-precision-recall-and-f1-score-36b5fd0dd3ec (accessed Mar.
26, 2023).
[2] S. Dash, “Decision Trees Explained — Entropy, Information Gain, Gini Index, CCP Pruning.,” Medium,
Nov. 02, 2022. https://towardsdatascience.com/decision-trees-explained-entropy-information-gain-giniindex-ccp-pruning-4d78070db36c (accessed Mar. 26, 2023).
[3] L. Makurumidze, W. S. Manjoro, and W. Makondo, “Implementing Random Forest to Predict Churn,”
IJCSMC, vol. 11, no. 2, pp. 75–84, Feb. 2022, doi: 10.47760/ijcsmc.2022.v11i02.009.
[4] “Machine Learning Random Forest Algorithm - Javatpoint.” https://www.javatpoint.com/machinelearning-random-forest-algorithm (accessed Mar. 26, 2023).
[5] “Predict Customer Churn – Logistic Regression, Decision Tree and Random Forest | DataScience+.”
https://datascienceplus.com/predict-customer-churn-logistic-regression-decision-tree-and-randomforest/ (accessed Mar. 26, 2023).
[6] “sklearn.model_selection.GridSearchCV — scikit-learn 1.2.2 documentation.” https://scikitlearn.org/stable/modules/generated/sklearn.model_selection.GridSearchCV.html (accessed Mar. 26,
2023).
[7] “sklearn.tree.DecisionTreeClassifier — scikit-learn 1.2.2 documentation.” https://scikitlearn.org/stable/modules/generated/sklearn.tree.DecisionTreeClassifier.html (accessed Mar. 26, 2023).
[8] S. L. Ph.D., “What is Machine Learning: A Short Note on Supervised, Unsupervised, Semi-Supervised
and…,” Medium, Mar. 02, 2023. https://towardsdatascience.com/what-is-machine-learning-a-shortnote-on-supervised-unsupervised-semi-supervised-and-aed1573ae9bb (accessed Mar. 26, 2023).
[9] “What is Model Training,” Oden Technologies. https://oden.io/glossary/model-training/ (accessed
Mar. 26, 2023).
[10] “Mockaroo.” https://www.mockaroo.com/